Jump to a section
A higher CPM can earn less when fewer ads run
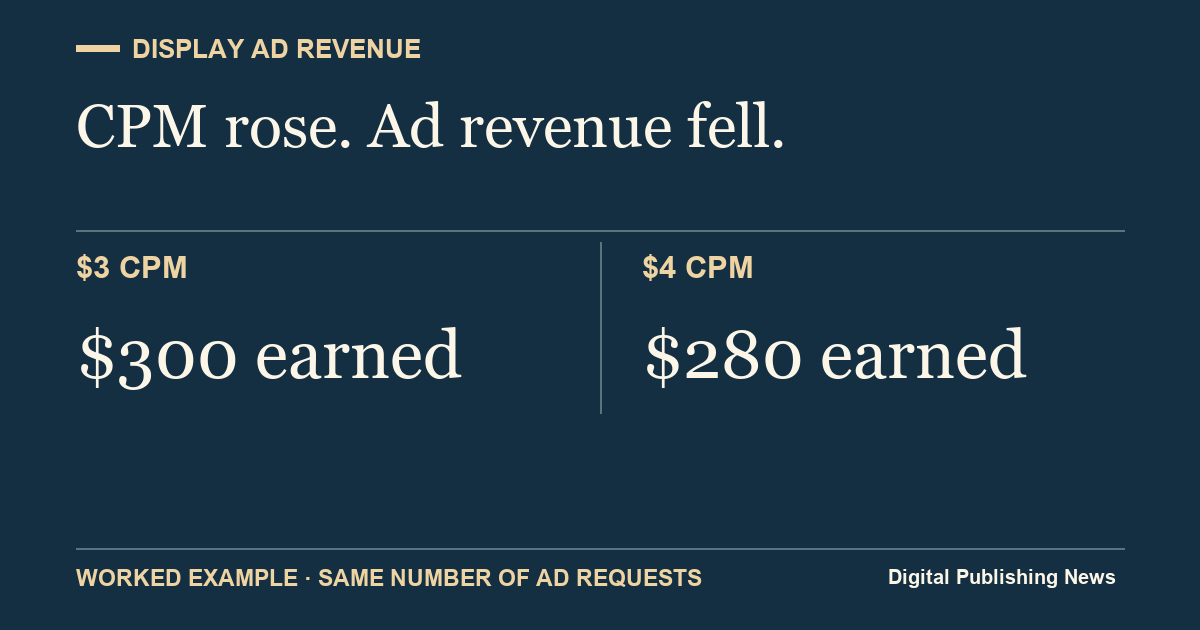
If your display ads earned $300 last week and $280 this week, a higher CPM may look like a reporting error. Check how many ads actually ran. At $3 per thousand paid impressions, 100,000 impressions earn $300. At $4, just 70,000 impressions earn $280. Each paid impression was worth more, but there were 30,000 fewer of them.
CPM means cost per thousand impressions. Publisher dashboards often use CPM or effective CPM (eCPM) for the average earned per thousand impressions. This walkthrough uses the amount the publisher keeps per thousand paid impressions, in U.S. dollars. If your report shows gross revenue before fees, use a consistent net revenue figure to calculate your rate for both periods.
Ad requests count opportunities your ad system received. Impressions count ads it recorded as shown under its counting rules. Fill rate is the share of requests that turned into impressions. Google Ad Exchange, Google’s marketplace for digital ads, also reports a request-based eCPM that already includes the effect of fill. Multiplying that rate by fill again understates revenue. (Google’s ad request and impression eCPM definitions ↗)
Export matching reports before you compare the rates
Start with two complete weeks with the same weekdays, time zone and currency. Filter both exports to the same site and display inventory. Keep video, house ads and other unpaid impressions out of the calculation if the revenue column excludes them. Keep the same filters when you pull ad requests, paid impressions and net earnings. Mixing a sitewide request count with one partner’s paid impressions gives you a misleading fill rate.
In Google Ad Manager, open Reporting, then Interactive reports, and create a historical report. Google’s sell-through guide describes Total ad requests and Total impressions, and defines Total fill rate as impressions divided by requests. Start with the matching display inventory. Use the net revenue source you actually reconcile for that inventory and cut both exports at the same point in the day. (Google Ad Manager’s sell-through reporting guide ↗)
If your dashboard shows pageviews but no request count, compare paid impressions per pageview across periods. That ratio can tell you fewer ads ran for each pageview. To determine whether there were fewer ad requests, more unfilled requests or fewer ads that rendered, you need the corresponding ad-serving counts.
Calculate how much the price and fill changes mattered
Suppose both weeks started with 200,000 eligible requests. The first week filled 50% of them and the second filled 35%. At the old $3 rate, the new fill would have earned $210, a $90 loss. The higher $4 rate earned back $70 on the 70,000 paid impressions. That explains the $20 drop.
Swipe or scroll to see all columns.
| Step | Requests | Paid fill | Net CPM | Revenue |
|---|---|---|---|---|
| Prior week | 200,000 | 50% | $3.00 | $300 |
| New fill at old CPM | 200,000 | 35% | $3.00 | $210 |
| Current week | 200,000 | 35% | $4.00 | $280 |
Use the same arithmetic to find the break-even point. At $4 per thousand, you need 75,000 paid impressions to earn $300. Across 200,000 requests, that would require 37.5% fill. The actual 35% fill was 5,000 impressions short. If you are considering keeping a higher price floor, that gap tells you how much inventory the new setting must recover.
If request volume also changed, swap in the new request count first while keeping the old fill and rate. Then swap in the new fill, and finally the new rate. For example, 220,000 requests instead of 200,000 would move the estimate from $300 to $330 at the old fill and rate. At 35% fill it falls to $231, and at $4 it climbs to $308. These three changes sum to $8. Changing their order changes how you allocate the gains and losses, so record the order when you share the comparison.
Find the placement or traffic source behind the change
Start with the ad placement that lost the most dollars. If requests fell, compare the matching pageviews and requests per pageview. If requests held steady and fewer ads showed, split the report by ad unit and device. If one mobile placement accounts for most of the drop, check that placement’s requests, returned ads and recorded impressions before changing prices for the whole site.
A sitewide CPM can rise simply because you lost cheap impressions. Suppose a homepage position served 40,000 impressions at $5 in both weeks. Article pages went from 60,000 impressions at $2 to 20,000 at the same $2. The sitewide CPM rose from $3.20 to $4.00 while revenue fell from $320 to $240. Neither placement earned a higher rate. The article pages just made up less of the total.
If you use Raptive, an ad management company for publishers, its Performance by Traffic Source report lets you compare pageviews, impressions per pageview and CPM by traffic source. If a newsletter sent fewer visitors this week, check the decline in impressions for that source before treating the blended CPM change as evidence that buyers paid more. (Raptive’s traffic source report and metric definitions ↗)
How one publisher reported growth in volume and yield
In an example where both moved up, Raptive reported that Pro Wrestling Stories, a site covering professional wrestling, had 16% more sessions, 24% higher session revenue per thousand sessions and 43% higher revenue from January 1 through September 20, 2026, compared with the same period in 2025. Those are the provider’s published figures. They use sessions as the denominator, so they show moves in audience volume and revenue per visit. They leave open what happened to ad fill or CPM. (Raptive’s Pro Wrestling Stories case study ↗)
Before you change a price floor or ask a partner what happened, write one sentence with the placement, period, impression count and dollars at stake. In the first example, it would be: “The same 200,000 requests produced 30,000 fewer paid impressions and $20 less revenue, even though net CPM rose by $1.” That gives someone enough information to pull the matching report and investigate.
If reported earnings look right but the deposit is short, check the statement against what reached your bank. Ad payout reconciliation calculator
Share this article
Editorial notes & history
Primary sources checked Nov 14, 2026. Worked figures are illustrative. Published results are attributed to their source.