Jump to a section
- Why a higher price per sold ad can reduce total revenue
- Chart or diagram
- Calculate both revenue measures
- The higher floor needs at least 640 fills to break even
- Decide whether to keep testing after break-even
- What if the price you actually collect is lower?
- A floor that works on desktop can lose money on mobile
Why a higher price per sold ad can reduce total revenue
Raising the minimum price for an ad can increase the price of the ads you sell while reducing the money you earn. The missing piece is fill: how many available ad opportunities actually become displayed ads. Compare total revenue across the same number of opportunities before calling a higher price a win.
Prebid is open-source software that collects bids from advertising buyers. Its price-floor module can reject bids below a configured minimum. That minimum is the floor; it is not a promise that a buyer will pay it. Prebid also provides controls for leaving some auctions outside floor enforcement so operators can compare results. (Prebid price floors module ↗ · Prebid introduction and header-bidding role ↗)
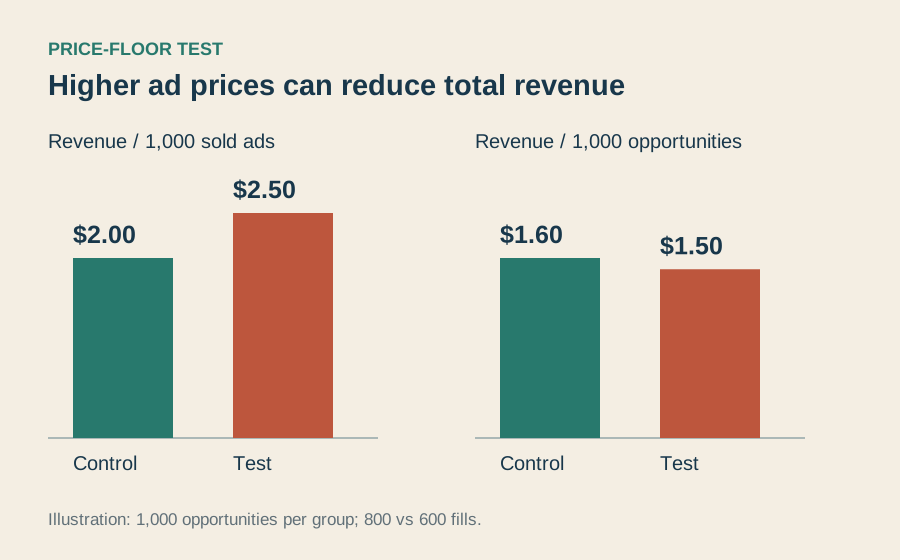
In this example, realized CPM is ad revenue per thousand paid impressions, after the same fees in both groups. It is calculated from revenue, not from average winning bids. The rate rises from $2 to $2.50, but fewer ads sell.

Calculate both revenue measures
In this hypothetical test, each group receives 1,000 opportunities. The control group, using the existing setting, fills 800 at $2 CPM: 800 × $2 ÷ 1,000 = $1.60. The higher-floor group fills 600 at $2.50 CPM: 600 × $2.50 ÷ 1,000 = $1.50.
Realized CPM rises 25%, but revenue per 1,000 assigned opportunities falls 6.25%.
| Measure | Control | Higher floor |
|---|---|---|
| Eligible opportunities | 1,000 | 1,000 |
| Filled impressions | 800 | 600 |
| Realized CPM | $2.00 | $2.50 |
| Revenue | $1.60 | $1.50 |
| Revenue / 1,000 opportunities | $1.60 | $1.50 |
The higher floor needs at least 640 fills to break even
Control earns $1.60 per 1,000 opportunities. At a $2.50 CPM, the test needs $1.60 ÷ $2.50 × 1,000 = 640 filled impressions to match that revenue. That is a 64% fill rate. The example’s 600 fills fall 40 short.
More generally, break-even test fill rate = control fill rate × control CPM ÷ test CPM. Here: 80% × $2 ÷ $2.50 = 64%. This is a useful screening calculation, not a substitute for an experiment: changing floors can change both CPM and fill.
For your test, define an eligible opportunity before bidding and keep that definition fixed in both randomly assigned groups. Export those opportunities, paid impressions and recognized net revenue over the same period. Include opportunities that produce no ad. Calculate realized CPM from those receipts and impressions, then check the fill threshold.
Decide whether to keep testing after break-even
The 640-fill threshold tells you what would match the control at the example price. It does not tell you how reliably the test can reach that threshold. Compare results over comparable weekdays and placements. If one day with unusually strong demand produces most of the gains, continue the test before changing the default. Record a rollback point in revenue per assigned opportunity so someone can reverse the change if the higher price stops compensating for the lost volume.
What if the price you actually collect is lower?
In the first example the higher floor yielded $2.50 per thousand paid impressions. Suppose the next week produces only $2.20 after fees, while the control still earns $1.60 per thousand opportunities. The test now needs about 728 paid impressions from each thousand opportunities to break even, because $1.60 divided by $2.20 is about 72.7%. The earlier 640-fill hurdle no longer applies.
This is a useful sensitivity check before expanding the test. If even your best comparable placements rarely sell 728 slots per thousand, a higher realized price of $2.20 offers little room for error. Keep the price and fill inputs separate in the decision record so a later change to either one can be evaluated without rebuilding the whole comparison.
A floor that works on desktop can lose money on mobile
Imagine an equal-sized split with 1,000 opportunities in each arm for desktop and another 1,000 in each arm for mobile. Desktop control sells 800 impressions at $2.00 per thousand, while desktop test sells 750 at $2.40. The corresponding revenues are $1.60 and $1.80. On mobile the same price change takes fill from 800 to 600, so control earns $1.60 and test earns $1.44. These are hypothetical results, using the same fee treatment in both arms.
With equal traffic on desktop and mobile, the test earns $3.24 versus $3.20. The overall gain is only 1.25%, and it hides a loss on mobile. If normal traffic is 30% desktop and 70% mobile, reweight the two segment results by those shares. The expected revenue per thousand opportunities would be $1.548 in test versus $1.60 in control. A test that looked profitable in the sample would lose about 3.25% on that traffic mix.
Define important segments before examining the numbers. Testing many small slices and keeping the best one can turn random variation into a decision. If desktop looks promising, follow up with a desktop-only confirmation rather than launching the setting on the strength of a four-cent aggregate gain.
Keep the eligible-opportunity count, paid impressions, and recognized net revenue for each arm and device. Check for differences in the ads that were eligible before attributing a change to the floor. For example, a mobile template that has fewer placements during the test changes the opportunity mix. Investigate that change before using the blended result. If you do adopt different rules by device, leave a comparable control running long enough to confirm that the margin survives normal demand changes.
Calculate the fill rate your test needs at its expected net CPM. Ad price floor break-even calculator
Share this article
Editorial notes & history
Source verification dates are recorded in the source registry. Sources were checked November 1–2, 2026. Original frameworks are editorial analysis; numerical examples are labeled. Shaun reviewed the preceding edition. This substantive revision awaits his review.
November 1, 2026: initial draft (v0.1.0); shorter title, reading layout and original visual added (v0.2.0); literal headlines, concrete procedures and reconciled examples (v0.3.0). November 2: substantive worked analysis and publisher-usefulness review (v0.4.0); writing SOP and attribution records (v0.5.0); full-body persona critiques and corrected reasoning (v0.6.0).