Jump to a section
- A modest revenue decline can produce a larger profit decline
- Chart or diagram
- Profit declined much faster than revenue
- At the old margin, adjusted EBITDA would be about £18 million higher
- Find out which operating question the margin gap raises
- Separate revenue mix from margin within each business
- Why the order of the margin bridge changes the split
A modest revenue decline can produce a larger profit decline
Future’s half-year 2026 results are a useful example of why revenue alone is an incomplete operating report. Adjusted EBITDA fell about 24% while reported revenue fell about 8%. The larger profit decline reflects a lower margin as well as lower sales.
Future is a specialist publishing business. EBITDA means earnings before interest, tax, depreciation and amortization; “adjusted” indicates further exclusions defined by the company. It is not the same as cash generated or statutory profit. Use the company’s definition consistently when comparing its two periods. (Future investor relations: FY2025 and HY2026 results ↗)

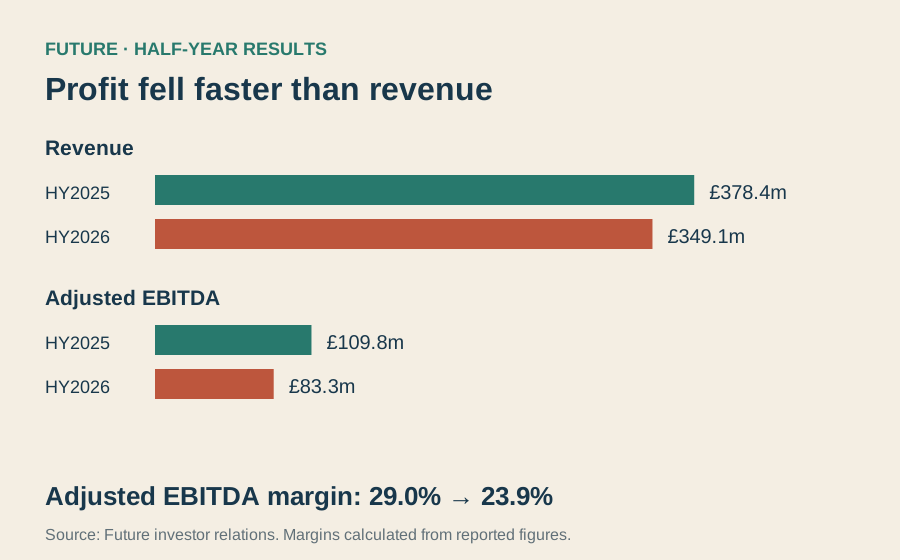
Profit declined much faster than revenue
Revenue fell £29.3 million, from £378.4 million to £349.1 million. Adjusted EBITDA fell £26.5 million, from £109.8 million to £83.3 million. The calculated changes are approximately 7.7% and 24.1%.
| Half-year measure | HY2025 | HY2026 |
|---|---|---|
| Revenue | £378.4m | £349.1m |
| Adjusted EBITDA | £109.8m | £83.3m |
| Calculated adjusted EBITDA margin | 29.0% | 23.9% |
At the old margin, adjusted EBITDA would be about £18 million higher
At the comparable 2025 half-year margin, £349.1 million of revenue would produce about £101.3 million of adjusted EBITDA. Actual adjusted EBITDA was £83.3 million, roughly £18.0 million less. This is a constant-margin comparison, not a forecast or an identified cost saving.
The calculation tells an operator why a revenue-only dashboard is insufficient. The business earned less revenue and retained a smaller share as adjusted EBITDA. It does not establish whether the margin change came from mix, fixed costs, investment or other factors.
Compare matching half-years and retain the adjusted label. The company’s 6% organic revenue decline is a separate measure from the reported decline; a full-year revenue figure is not the baseline for either.
The £26.5 million adjusted EBITDA decline can be split arithmetically into about £8.5 million from applying the old margin to the lower revenue, plus the roughly £18.0 million remaining margin difference. Use that split to ask which products, costs or investments explain the variance. Do not turn the £18.0 million into a cost-cutting target: this calculation has not identified removable costs.
Find out which operating question the margin gap raises
Start with the gap between the hypothetical earnings at the old margin and the actual figure. Break the next investigation into revenue mix, directly attributable costs, and overhead.
For your own publication, compare periods that contain the same businesses and use the same definitions. Label changes in what is included before building a cost-cutting target. If a product’s share fell, calculate how much of the margin movement comes from its lower weight before assuming the product itself became less profitable. Use that result to decide which costs or revenue lines deserve a closer look.
Separate revenue mix from margin within each business
Consider a publisher earning 30% on a $100,000 product and 10% on a second $100,000 product. Combined margin is 20%. If the first line falls to $50,000 and the second stays at $100,000, the combined margin falls to roughly 16.7% even if neither line’s own margin changes. The sales mix alone can explain the change in this example.
For a real analysis, calculate the new combined margin using the old margins by business and the new sales mix. Compare it with the actual combined result. The difference gives you a more specific operating question than a headline margin change. If the company does not disclose the needed breakdown, label the interpretation as a hypothesis.
Why the order of the margin bridge changes the split
The original bridge applies the old margin first. You can also reverse the order: apply the new margin to the old revenue, then account for the smaller revenue base. With a new margin of £83.3 million divided by £349.1 million, the old £378.4 million of sales would yield about £90.3 million. That places roughly £19.5 million in the margin step and about £7.0 million in the revenue step.
Both bridges reconcile to the same £26.5 million decline after rounding. They put the interaction between revenue and margin in different steps. For a management report, label which margin you held constant and use the same convention across periods. Otherwise a reader could mistake a change in calculation method for a change in the business.
A publisher can use the same bridge internally. First compute the earnings expected at the old margin on the new revenue. Then separate products with enough detail to explain the difference. If a high-margin affiliate line lost volume and low-margin events held steady, the consolidated margin may fall even though each business performed at its old rate. If product shares barely changed, compare each line’s contribution and its directly attributable costs.
Ask for the breakdown that would distinguish those possibilities. Revenue by business line on the same basis and period is a start, but margin or attributable costs by line are needed to quantify the mix effect. When only the consolidated totals are available, report the arithmetic bridge and leave the cause open. This keeps an earnings analysis from turning an unexplained residual into a cost-cutting prescription.
Calculate a revenue stream’s share before comparing the mix across periods. Publisher revenue mix calculator
Share this article
Editorial notes & history
Source verification dates are recorded in the source registry. Sources were checked November 1–2, 2026. Original frameworks are editorial analysis; numerical examples are labeled. Shaun reviewed the preceding edition. This substantive revision awaits his review.
November 1, 2026: initial draft (v0.1.0); shorter title, reading layout and original visual added (v0.2.0); literal headlines, concrete procedures and reconciled examples (v0.3.0). November 2: substantive worked analysis and publisher-usefulness review (v0.4.0); writing SOP and attribution records (v0.5.0); full-body persona critiques and corrected reasoning (v0.6.0).